
Add Satellite Data to QGIS via JAXA Earth API
What you'll learn
- How to retrieve satellite data in QGIS with JAXA Earth API
- How to use a plugin to visualize satellite data
- How to overlay satellite observation data in QGIS
Recommended for
- Anyone who wants to use satellite data in QGIS
- Anyone who wants to know what satellite data JAXA Earth API provides
Introduction
The Japan Aerospace Exploration Agency (JAXA) publishes Earth observation data such as air temperature, precipitation, and vegetation, and you can retrieve it with the JAXA Earth API. Built on this API, the JAXA Earth API Plugin lets you search and view satellite data from QGIS in just a few clicks.
This article explains how to retrieve satellite data with the JAXA Earth API Plugin in QGIS and which datasets you can use.
To learn the basics of satellite data, see the article from Sorabatake.
What is JAXA Earth API?
JAXA Earth API is a satellite data distribution service written in Python and JavaScript. For details on the API and the available datasets, see the official site.
JAXA Earth API offers more than 70 datasets, including elevation, land surface temperature, vegetation index, precipitation, and land cover classification maps, and is expected to be used in a wide range of fields.

How to use the QGIS JAXA Earth API Plugin
This section shows how to install the JAXA Earth API Plugin in QGIS and retrieve satellite data.
Add an OpenStreetMap basemap in QGIS
A basemap is useful when you use the plugin, so start by displaying OpenStreetMap as the basemap.
In the Browser panel, double-click OpenStreetMap under XYZ Tiles.

OpenStreetMap now appears on the map canvas.

Install the JAXA Earth API Plugin
Next, install the JAXA Earth API Plugin.
From the menu bar, click Plugins → Manage and Install Plugins.

The Plugins dialog opens. Follow these steps to install the JAXA Earth API Plugin.
- Select the All tab
- Enter
JAXAin the search box - Select JAXA Earth API Plugin from the list
- Click the Install Plugin button

When the installation finishes, the JAXA Earth API icon appears in the toolbar.
Click the icon to open the plugin dialog.

Plugin usage example
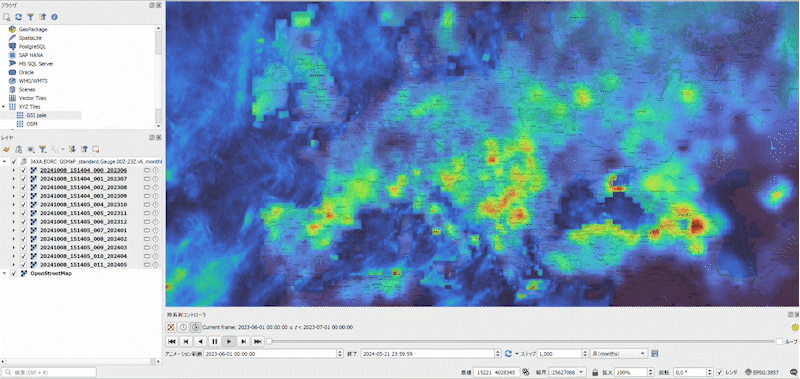
This example displays monthly rainfall data for Europe.
-
Select the dataset (example: Precipitation Rate (Monthly), monthly rainfall)
-
Specify the date range (Filter-Date)
-
Specify the map extent
a. Click the Map Canvas Extent button to set the current map extent.
b. You can also click the Draw on Canvas button to set a custom extent.
-
Click the Load button to load the data.

The plugin loads the satellite data for the specified period. If more than one dataset matches the search conditions, the plugin adds multiple layers.

Animate the data over time
In the rainfall dataset, each layer covers one month. Because this is time series data, you can also use the Temporal Controller to show the change as an animation.
To do this, open the properties of each layer, set the date and time on the Temporal tab, and check the animation in the Temporal Controller. Layers added by the JAXA Earth API Plugin come with the date and time already set automatically (some datasets are not set).

To show the Temporal Controller, check View → Panels → Temporal Controller Panel in the menu bar.

Click the play button to display the data over time. The Temporal Controller visualizes the monthly change in rainfall as an animation.
Satellite datasets
Here are three satellite datasets available through JAXA Earth API.
Vegetation index (NDVI)
NDVI (Normalized Difference Vegetation Index) is an index that quantifies the distribution and vigor of vegetation using red light and near-infrared obtained from optical satellites.
Vegetation index observation data is available from 2018 at monthly, half-monthly, and daily intervals. You can therefore use it to monitor seasonal vegetation conditions and to check the effects of deforestation and forest fires.
The example below compares the vegetation index around Nusantara, Indonesia's new capital, in August 2010 and August 2024. At the same location, you can see that the vegetation index has decreased slightly and urban development is progressing.

Rainfall
Japan and the United States lead the Global Precipitation Measurement (GPM) Mission, which observes rain and snow at high frequency using a group of satellites equipped with a dual-frequency precipitation radar.
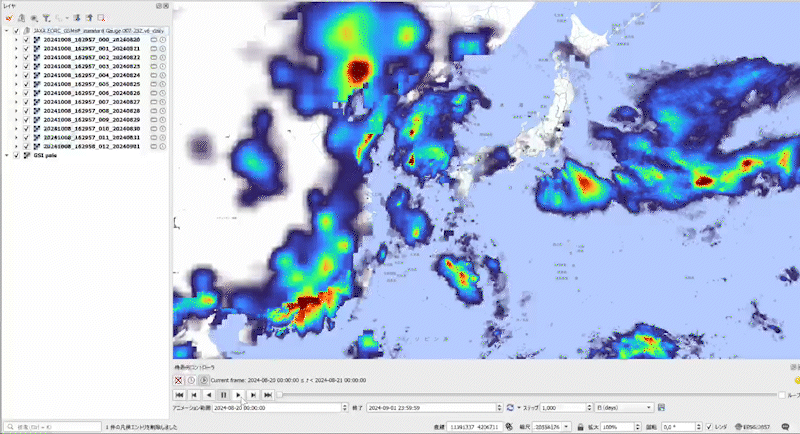
Rainfall observation data is available from 2000 at monthly, half-monthly, and daily intervals. You can also monitor precipitation throughout the year or by season.
The example below shows daily rainfall from Typhoon No. 10 (Shanshan) in 2024 as a time series animation. You can see that rainfall increases because of the typhoon.
Sea ice concentration
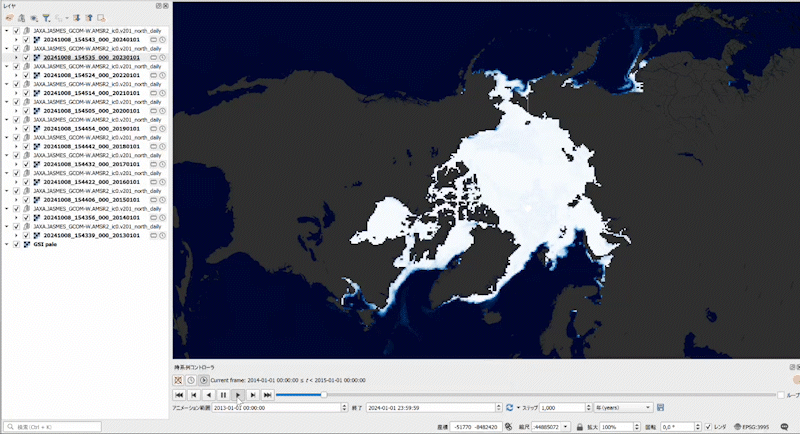
Since July 2012, sea ice concentration data for the Arctic and Antarctic has been provided daily. This makes it possible to monitor changes in ice sheets over many years.
This example visualizes Arctic observation data for January 1 of each year from 2013 to 2024. You can see that since the 2020s, ice reaches Canada's Labrador Peninsula less often.
Conclusion
As this article showed, the JAXA Earth API Plugin lets you easily add satellite data to QGIS. QGIS's temporal features also let you display the changes as an animation.
Besides the satellite data covered here, JAXA Earth API provides more than 70 datasets, including land surface temperature, sea surface temperature, and the digital surface model. See the full list below.
https://data.earth.jaxa.jp/ja/datasets/
The JAXA Earth API Plugin is published as open source. To report bugs or suggest improvements, open an issue in the GitHub repository.

QGIS LAB is a comprehensive information hub for QGIS, the open-source GIS software. Under the concept of “Geospatial for Greater Good,” we share the knowledge and skills to open up the world through location data.


