
Terrain Analysis with Tokyo Digital Twin DEMs
What you'll learn
- How to visualize the “3D point cloud data” for the Tama and island areas
- How to analyze terrain with grid data (DEM)
Recommended for
- Anyone who wants to visualize point cloud data in QGIS
- Anyone interested in terrain analysis with QGIS
Introduction
On September 1, 2023, the Tokyo Metropolitan Government released “3D point cloud data” for the Tama and island areas. The release includes the following types of data:
-
Point cloud data
-
Orthoimages
-
Contours
-
Grid data (DEMs at 0.25 m and 0.5 m resolution)
-
Micro-topography maps
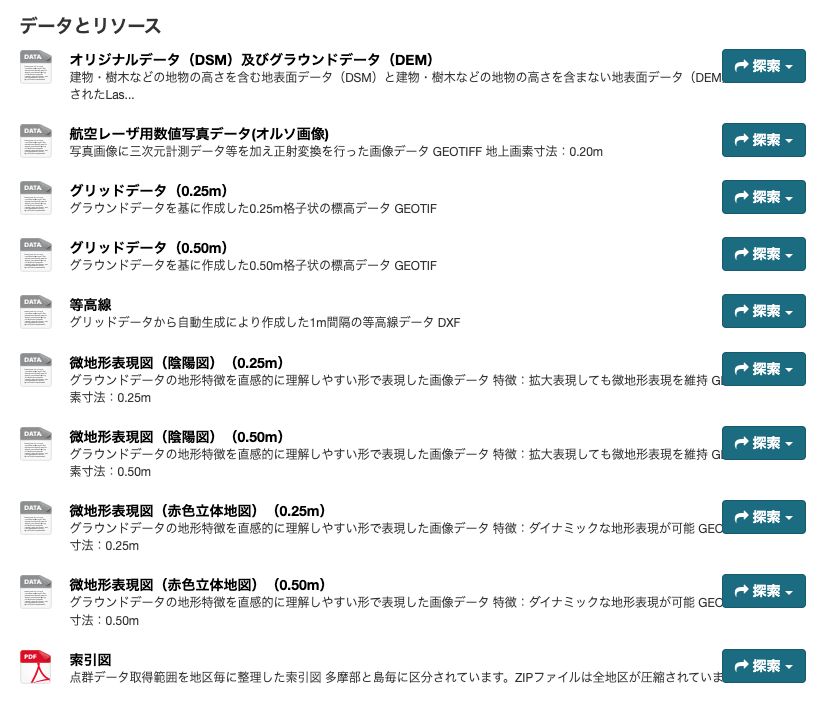
Tokyo Digital Twin Island Area Point Cloud Data

Of these, the grid data (DEM) is well suited to terrain analysis. This article tries out the terrain analyses available in QGIS with this grid data (DEM).

Data preparation
The terrain analysis area is Shikinejima, and the data is its 0.5 m resolution grid data (DEM). Download the data and unzip it.

Import the unzipped data into QGIS, then choose Raster → Miscellaneous → Build virtual raster from the menu bar. For Input layers, select all the grid data (DEM) files you unzipped, and click Run. This creates a virtual raster.

Right-click the virtual raster in the Layers panel and choose Export → Save As. In the Save Raster Layer as dialog, select GeoTIFF as the Format, enter any File name, and click OK. This saves the Shikinejima grid data (DEM) as a single GeoTIFF file.

In QGIS, the Shikinejima grid data (DEM) saved as a single GeoTIFF file is rendered as shown below. The data is now ready for terrain analysis.

Terrain analysis
QGIS can perform the following terrain analyses:
- Creating a shaded relief map
- Creating a slope map
- Creating an aspect map
- Creating a hypsometric tint map
- Calculating a terrain ruggedness index map
Shaded relief
A shaded relief map is a type of map that represents the relief of terrain with color and shadow. In QGIS, select Processing Toolbox → Raster terrain analysis → Hillshade, adjust settings such as the direction of sunlight, and create the shaded relief map.


Slope
Slope shows the inclination angle of terrain. In QGIS, select Processing Toolbox → Raster terrain analysis → Slope to create a slope map.


Aspect
Aspect is the direction that a terrain slope faces. It is usually expressed as an azimuth, an angle that increases clockwise from north (0 degrees, or 360 degrees). In QGIS, select Processing Toolbox → Raster terrain analysis → Aspect to create an aspect map.


Hypsometric tint map
A hypsometric tint map is a type of map that shows terrain height in different colors. By expressing height differences through shades of color or different hues, it makes the features and relief of the terrain easier to grasp visually. In QGIS, select Processing Toolbox → Raster terrain analysis → Relief to create a hypsometric tint map.


Terrain ruggedness index (TRI)
The terrain ruggedness index (TRI) is an indicator that quantifies the ruggedness and complexity of terrain. It is calculated from the differences between the height of a given point and the heights of the points around it. In QGIS, select Processing Toolbox → Raster terrain analysis → Ruggedness index to calculate the terrain ruggedness index (TRI).


Calling SAGA functions also enables the following terrain analyses:
- Creating a curvature map
- Creating watershed boundaries
- Creating a drainage network
Curvature
A curvature map is a type of map that shows terrain curvature. Terrain curvature indicates how the ground surface curves, and it is an important tool for understanding fine terrain features and how the terrain formed. In QGIS, select Processing Toolbox → SAGA → Terrain Analysis - Morphometry → Slope, aspect, curvature to calculate curvature (slope and aspect are calculated at the same time). You can choose a curvature type, such as plan or profile.


Watershed boundaries
Watershed boundaries separate different watersheds (the area a river flows through, or the area where its flowing water collects). In QGIS, select Processing Toolbox → SAGA → Terrain Analysis - Hydrology → Fill sinks (wang & liu) to create watershed boundaries. Besides the watershed boundaries, the following rasters are also created:
-
DEM with sinks removed
-
Flow direction
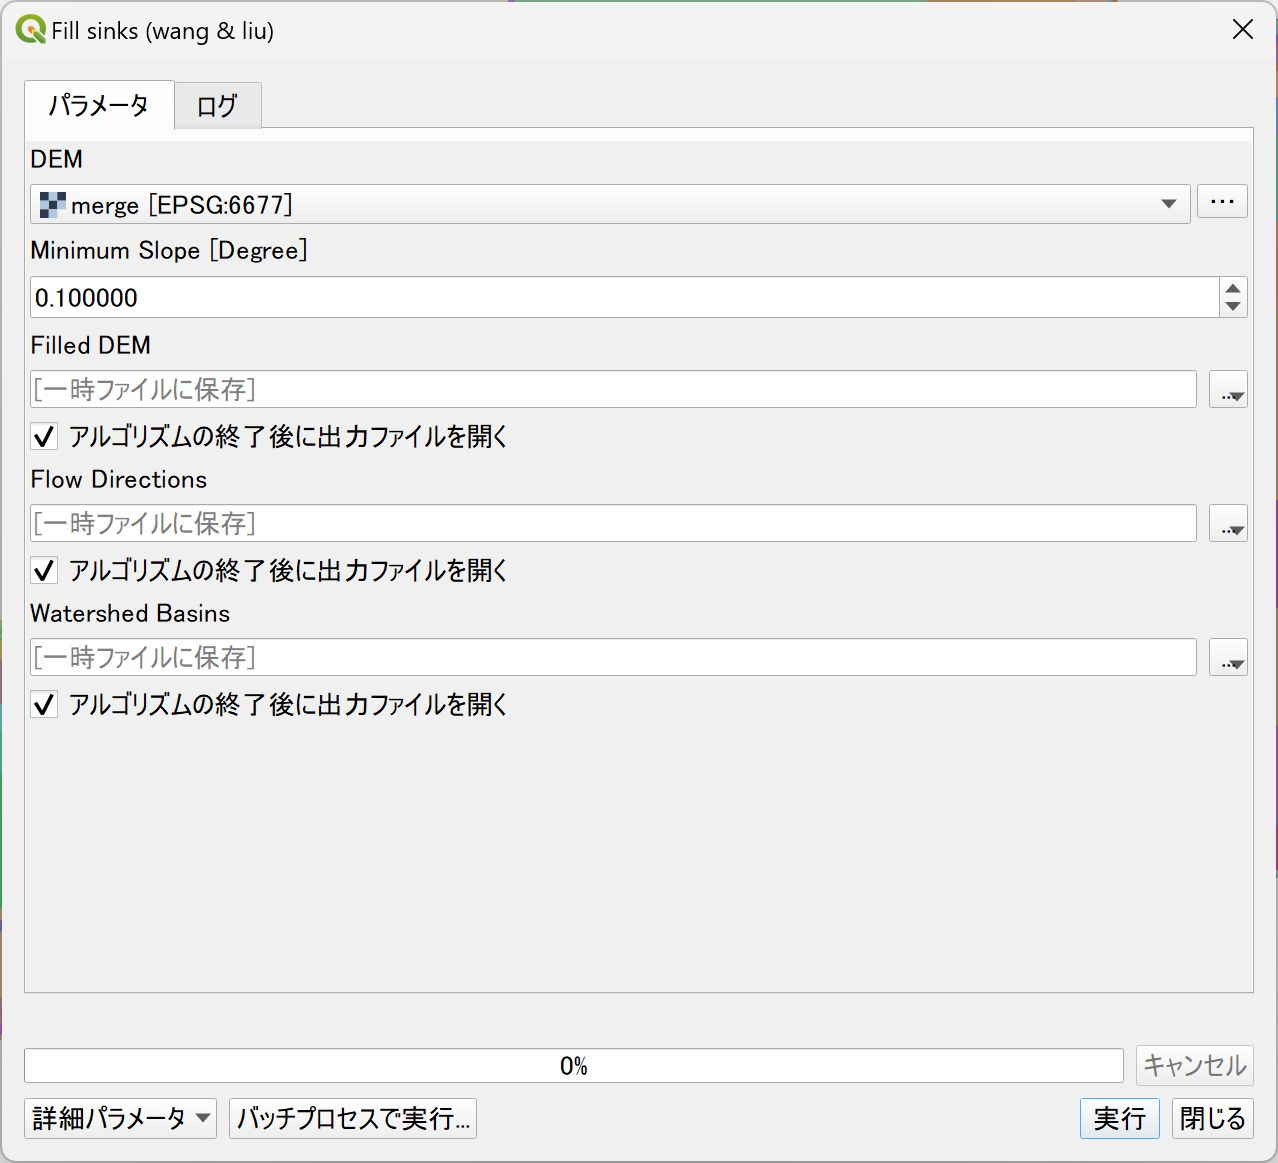
The Fill sinks (wang & liu) tool dialog


Drainage network
A drainage network is the entirety, or the network, of flowing water in a given area: rivers, tributaries, streams, and so on. In QGIS, select Processing Toolbox → SAGA → Terrain Analysis - Channels → Channel network and drainage basins to create a drainage network (vector). Note that for Elevation in Channel network and drainage basins, you must select the grid data (DEM) with sinks removed. This is the DEM created when making the watershed boundaries described above.
In the figure below, the drainage lines are drawn with their width varying by the value of the ORDER field.


Conclusion
As shown above, QGIS can perform a variety of analyses with grid data (DEM). In recent years, government agencies have begun publishing the results of airborne laser surveys. This makes high-precision terrain data easier to obtain, and terrain analysis is expected to bring new discoveries and solutions to problems. Terrain analysis should have many applications, such as understanding terrain characteristics and how they have changed, assessing the risk of terrain-related disasters, and optimizing urban planning and land use.
Try terrain analysis using airborne laser survey data!

QGIS LAB is a comprehensive information hub for QGIS, the open-source GIS software. Under the concept of “Geospatial for Greater Good,” we share the knowledge and skills to open up the world through location data.


