
Get More from Mapsuke: Tasks, Tools, Plugins
What you'll learn
- How to hand off multi-step work, such as georeferencing a drawing or analyzing satellite images over time
- How to save a process built in chat as a Processing tool
- How to combine Mapsuke with installed plugins and custom prompts
Recommended for
- Anyone who has tried the basics of Mapsuke and wants to know what to do next
- Anyone who repeats routine GIS tasks and wants to automate them without writing Python
- Anyone who spends a lot of time digitizing drawings or analyzing satellite images
Introduction
Mapsuke, a plugin that operates QGIS through chat, can do more than make maps. You can hand it work that runs from fetching and processing data to aggregating and summarizing it, save a process you built as a tool, and combine Mapsuke with other plugins.
This article introduces advanced ways to use Mapsuke. For installation and basic use, see the following article.

Hand off work that needs multiple steps
For work that runs through several stages, such as fetching, processing, aggregating, and summarizing data, state the goal in one sentence and the agent carries out the steps in order. It asks you only where a decision is needed, and once you answer, it moves on to the next step.
Georeference a drawing without coordinates and draw from it
In GIS work, you sometimes overlay a drawing from a PDF or image on a map and turn the areas it shows into GIS data. By hand, you set GCPs (ground control points) in the Georeferencer, then trace the areas on the aligned image.
Enter Georeference the wide-area urban area map of Chiba Prefecture, add it, and draw polygons for the urban areas in Mapsuke, along with the URL of the drawing's PDF. In this example, the agent downloaded the PDF, converted it to an image, matched the outline of the prefecture to the administrative area data from National Land Numerical Information to fix its position, and drew the urban areas as six polygons.
For how to georeference, see the following article.
View NDVI over time from satellite images
Analyzing satellite images over time takes quite a few steps: searching for and fetching images, calculating an index, aggregating by area, and making an animation. By hand, you find and download images one at a time, then calculate and aggregate, repeating the work for every observation date.
Enter Calculate the normalized difference vegetation index (NDVI) for each rice field in Higashikawa, Hokkaido, from August to October, and create an animation in Mapsuke. In this example, the agent searched for Sentinel-2 images with STAC, chose and fetched observation dates with little cloud cover, aggregated NDVI for each Fude polygon, and made an animation of how NDVI changed across the observation dates.
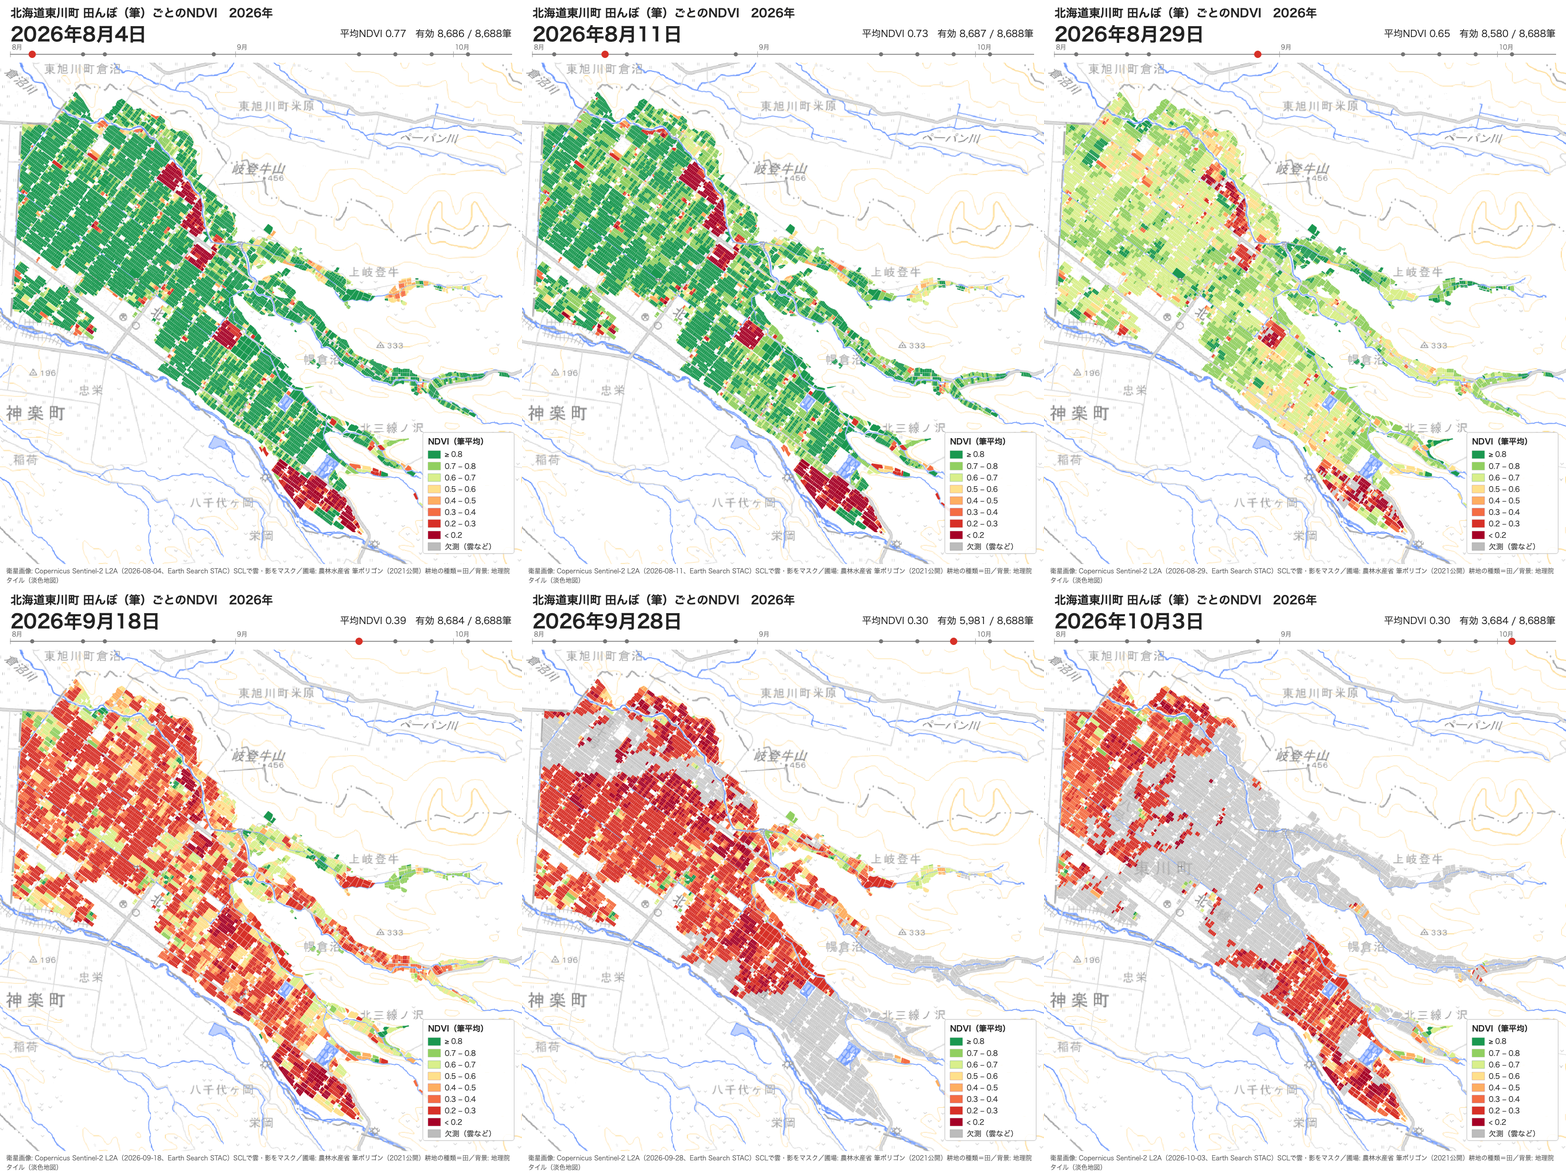
Next, enter Create a report from this data. Mapsuke creates a PDF report that lays out a summary of the key points, a graph of the change, and a map for each observation date. A skill built into Mapsuke produces the report, so it comes out well formatted even without detailed instructions.

Save repeated work as a tool
A series of steps you built in chat can be saved as a Processing tool, which you reuse by swapping the inputs. This is handy for repeated work, such as aggregating data that is updated every month.
Once you have checked the result, enter Save this procedure as a tool in the chat. The agent bundles the process into a Processing script, registers it, and tests that it works on a small dataset.
The registered tool appears under Scripts in the Processing Toolbox, and you can run it like any other tool. From then on, you only need to specify the inputs, and you can share the tool with people who do not use Mapsuke.

Combine with installed plugins
Processing tools from plugins you have installed are also available to the agent. Enter Get the elevation tiles from the Geospatial Information Authority of Japan (GSI) for the current map extent and make a CS (curvature and slope) topographic map, and the agent does the work with the ElevationTile4JP and CSMap Plugin you already have installed. Where a decision is needed, such as choosing a resolution, it asks you.

Because the agent uses the tools of the plugins you already know as they are, you get the same results as working by hand. If you turn procedures you use often at work into Processing tools, the agent can pick and run them.
Set working rules with a custom prompt
In Custom prompt on the General tab of Settings, you can write instructions that apply to every session. For example, if you write Save outputs as GeoPackage, you no longer have to say it each time. Put your working rules here, such as the coordinate system, where to save files, and how to name output files, and the agent follows them.

Conclusion
Digitizing a drawing and analyzing satellite images both take time by hand, yet both moved forward just by entering instructions in chat. Judging which processing is appropriate, and whether the result is valid, is still up to you, but you can hand off the hands-on parts to the agent.
If you have similar work, try it in Mapsuke on a small area first. Save the procedures that work well as tools, and next time you only need to change the inputs.
For the basics of Mapsuke, see the following article.
Data sources
- Wide-Area Urban Planning Map (Chiba Prefecture)
- National Land Numerical Information “Administrative Area Data” and “Prefectural Land Price Survey Data” (Ministry of Land, Infrastructure, Transport and Tourism)
- Fude Polygon Data (Ministry of Agriculture, Forestry and Fisheries)
- GSI Elevation Tiles and GSI Tiles
- Copernicus Sentinel-2 L2A (Contains modified Copernicus Sentinel data 2026)

QGIS LAB is a comprehensive information hub for QGIS, the open-source GIS software. Under the concept of “Geospatial for Greater Good,” we share the knowledge and skills to open up the world through location data.


