
Embed Interactive Maps on Websites with Kumoy
What you'll learn
- How to embed a Kumoy web map in a web page
- How to choose what the embedded map shows: map name, description, layers, and controls
- The access level embedding requires, and what to check on the web page side
Recommended for
- Anyone who wants to put a map made in QGIS on a company website or blog
- Anyone who wants to show a web map that readers can interact with, not just an image
- Anyone who wants to learn how to embed a map with an iframe
Introduction
When you show a QGIS map on a web page as an image, viewers cannot pan to the place they care about or zoom in for detail. Building a web map from scratch is another option, but it requires a map display system and a server.
Kumoy's embed feature lets you put a map you made in QGIS and saved to Kumoy on a web page as an interactive map. Choose the items to display, such as the map name and layers, and paste the generated code into your web page. That is all it takes.
This article shows how to put a map on a web page with Kumoy's embed feature.
To learn more about Kumoy, or about how to save a map from QGIS, see these articles too.
What is Kumoy's embed feature?
Kumoy's embed feature displays a web map you have published in Kumoy inside another web page, using an HTML element called iframe.
A regular share link opens the Kumoy web map on a separate page. With embedding, you can place the map inside a page on your company website, blog, or media site, so viewers can explore it without leaving the page.
In an embedded map, viewers can drag to pan, zoom in and out, and show or hide layers. That is the difference from an image: viewers can explore the map however suits their purpose.
You can also show only what the page and its readers need, such as the map name, description, and buttons. This makes it easier to fit a map into the limited space of a web page.
Steps to embed a map in a web page
Save the map to Kumoy
To use the embed feature, first save your QGIS project to Kumoy as a map.
For the steps to save a map from QGIS, see this article.
Open the share dialog
Once the map is saved to Kumoy, log in to Kumoy on the web, open the project from the dashboard, and select the map you want to embed.
With the map open, click the share button (the blue arrow) at the top right.

The Share Map dialog opens. Under Who can access, check the map's current access level.

If the access level is Private, change it to Public or Protected access before you go to the embed settings. Changing the access level changes who can view the map, so check what information the map contains first.

Choose what to display
In the Share Map dialog, click Embed to open the Embed settings screen.
Use Sidebar and Controls on the right to choose what the embedded map shows.

You can set the following items. Turn off the toggle to the right of an item to hide it.
| Category | Item | What it shows |
|---|---|---|
| Sidebar | Map name | The map name set in Kumoy |
| Sidebar | Description | The description and source attribution set for the map |
| Sidebar | Layers | The layer list, legend, and buttons to show or hide layers |
| Controls | Zoom | Buttons to zoom the map in and out |
| Controls | Compass | A button that shows the map's orientation and turns it back to north |
| Controls | Current location | A button that moves the map to your current location using your device's location |
| Controls | Scale bar | A scale bar that shows distances on the map |
For example, if you embed a map in an article that already explains the map's purpose, hiding Description frees up space for the map. If you want viewers to switch layers and compare them, show Layers.
Adjust the map view
Drag the map in the preview, and scroll or use the zoom buttons to set the scale. The center position and zoom level carry over to the embed code, so place the area you want to show in the center of the map.
View on the right shows the current center position and zoom level. Click Reset to return to the view the map has when it first opens.

Copy the code and paste it into your web page
When the display items and the view are set, click Copy code.

The copied code is an iframe element like the one below. Kumoy fills in the map ID and display settings, so you do not usually need to write any code yourself.
<iframe
src="https://app.kumoy.io/embed/map/6e81496d-77e2-43d5-b6dd-10bf423392e3?title=1&description=1&layers=1&zoomControl=1&compassControl=1&geolocateControl=1&scaleControl=1&center=140.09%2C35.4&zoom=9.58"
width="100%"
height="480"
style="border:0"
loading="lazy"
referrerpolicy="strict-origin-when-cross-origin"
allow="geolocation"
title="公共交通空白地の抽出 - Kumoy"
></iframe>
In your web page editor, open a block that accepts HTML or the source editor, and paste the code. Before you save or publish, open the preview and check that the map appears and that you can interact with it.
Here is the map from this article, embedded live. You can pan the map and click its buttons.
Some CMSs and web publishing services remove iframe elements for security reasons. If yours does, ask the service administrator or the person in charge of your website how to embed external content.
Embed a Kumoy map in Notion
So far, you have embedded the map by pasting the generated iframe code into HTML. Some services skip the embed code: you paste the map URL and the map appears.
Services that support rich embeds (oEmbed), such as Notion, can show the map from the URL alone. Copy the URL with Copy Link in the Share Map dialog of a published map, then paste it.

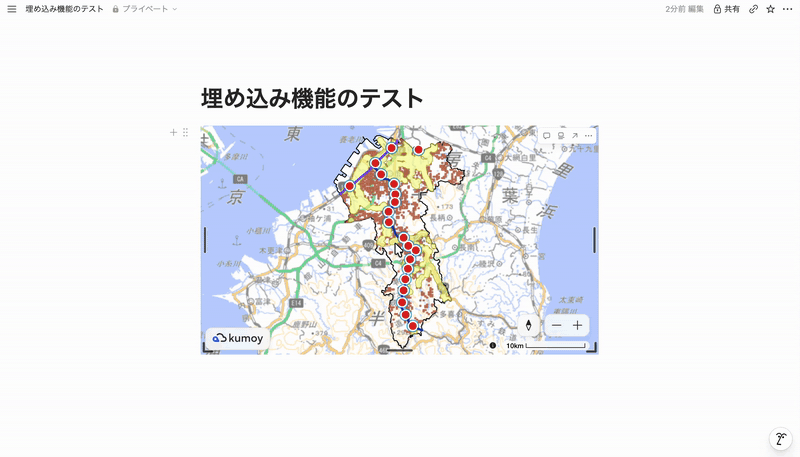
In Notion, paste the URL into a page and select Embed.

The map appears in the Notion page, where you can pan, zoom, and check attribute information.
Conclusion
With Kumoy's embed feature, you can put a map made in QGIS on your company website or blog as a web map that viewers can pan and zoom. You only paste the generated code, so you do not need to build map display from scratch.
You can also choose the map name, description, layers, and buttons to suit your purpose, and set the area to show while you watch the preview. Viewers can see for themselves the geographic spread and the relationships between layers, which are hard to convey in a still image.
To get started, open the embed settings for a map you have already published, and use the preview to build a display that fits your web page.
Data sources
- GSI Tiles
- National Land Numerical Information “Railway Data” (Ministry of Land, Infrastructure, Transport and Tourism)
- National Land Numerical Information “Administrative Area Data” (Ministry of Land, Infrastructure, Transport and Tourism)
- National Land Numerical Information “250 m Mesh Future Population Estimates (2024 estimates by the National Spatial Planning and Regional Policy Bureau)” (Ministry of Land, Infrastructure, Transport and Tourism)

QGIS LAB is a comprehensive information hub for QGIS, the open-source GIS software. Under the concept of “Geospatial for Greater Good,” we share the knowledge and skills to open up the world through location data.


