
Looking Back at QGIS 3.0 to 3.32: Why Upgrade
What you'll learn
- How the current version of QGIS has developed so far
Recommended for
- Anyone interested in the new features of QGIS
- Anyone interested in how QGIS features have changed over time
Introduction
QGIS 3.0 was released in February 2018, and about five years later, as of August 2023, QGIS has reached version 3.32. This article looks back at the evolution of QGIS 3.x and revisits new features and handy improvements that are easy to overlook. Even if you use QGIS every day, you may find something new. If you use an older version of QGIS, now is a good time to update to the latest one. It is not only about eye-catching new features: fewer bugs, better performance, and many small refinements add up to a gain in work efficiency that is hard to ignore.
Here are some of the advances in QGIS 3.x.

Support for new data sources
QGIS 3.x added support for the following data sources.
Mesh data support
Since QGIS 3.2, QGIS can handle the various kinds of mesh data used to represent weather data, water flows, terrain (digital elevation model, or DEM), and more. It can display huge mesh datasets quickly and also handle temporal information.

QGIS 3.12 strengthened the display of vectors (Vector Trace Animation and Streamlines for Mesh Layer), and improvements have continued. For example, QGIS 3.22 lets you edit meshes in QGIS.
Point cloud support
Since QGIS 3.18, you can load point cloud data. Energetic enhancements have followed. QGIS 3.20 added support for remote datasets (EPT). QGIS 3.22 added point cloud filtering and Cloud Optimized Point Clouds (COPC) support. QGIS 3.32 added native Processing algorithms for point clouds and support for virtual point clouds (VPC).
Vector tile support
Raster tiles have long been available, but since QGIS 3.14, QGIS can also display vector tiles. You can also import Mapbox GL JSON styles (QGIS 3.16). A Processing algorithm that generates vector tiles was added at the same time. More recently, QGIS gained the ability to select features in vector tile layers (QGIS 3.28) and the Download vector tiles algorithm, which saves tiles in bulk (QGIS 3.32).
Other
- QGIS 3.24 added support for Terrain RGB raster tiles, which represent terrain (DEM) data as raster tiles.
- QGIS 3.30 added support for raster attribute tables (RAT), which give meaning to the values of a raster layer through a separate table.
- Integration with external data sources such as PostgreSQL, Oracle, WMS/WMTS, and ArcGIS MAP also seems to have been steadily strengthened and improved.
Major improvements to coordinate transformation
QGIS 3.8 made major improvements to coordinate transformation handling. QGIS dropped its own management of coordinate transformations and now leaves it to PROJ, the engine it uses behind the scenes, to suggest the best transformation method.
A clear benefit in Japan is that, when converting between JGD2000 and JGD2011, you can now choose a transformation that uses a grid shift (correction parameters for the 2011 Tohoku earthquake). If you do not have the grid shift file, QGIS shows a warning, and you can install the file by clicking a button (see the figure below).

Performance improvements for a smoother experience
- QGIS 3.18 improved redrawing when you move the map (Smarter Map Redraws). There is less flicker, and the map feels less frustrating to work with.
- QGIS 3.4 added OpenCL based acceleration for some raster processing and display. You can enable it under Acceleration in the QGIS options.
- Several parts of Processing that were written in Python have also been rewritten in fast native code.
These are only a few of the many small fixes that improve performance. If you work with heavy data, you may notice the difference especially.
Support for georeferencing vector data
QGIS 3.26 made it possible to georeference vector layers in the Georeferencer. QGIS 3.18 also made it possible to rotate the Georeferencer canvas.
A user interface that improves efficiency
There are many small usability improvements. A few examples:
- Spatial bookmarks, which let you register frequently used map extents, were supercharged in QGIS 3.10. Combined with bookmark searching in the locator, added in 3.2, they let you jump to a location with a single keyboard action. In 3.32, you can also save the map rotation.
- In QGIS 3.8, you can use Zoom to Layer(s) with several layers selected. The map zooms so that all the selected layers are visible.
- Examples of attribute table improvements:
- In QGIS 3.14, when the Open attribute table as docked window setting is on, attribute tables open as tabs. This is convenient when you work with several attribute tables.
- In QGIS 3.24, the attribute table gained Autosize All Columns and Set All Column Widths.
- In QGIS 3.28, you can right-click a class in the layer legend and select Show in Attribute Table to open the attribute table filtered by that class.
- Examples of improvements to identifying features:
- QGIS 3.28 added a setting to hide NULL values in the identify results. This is convenient when you work with data that contains many NULL values.
- QGIS 3.30 added an option to identify features just by hovering the mouse, with no click.
More expressive print layouts
Print layouts have also had many improvements. For example:
- QGIS 3.8 made it possible to create a north arrow with a single button, and 3.14 made it possible to sync any symbol with the orientation of the map.
- QGIS 3.14 supports pasting images directly into print layouts.
- In QGIS 3.18, legends for continuous values can be shown as a gradient.
There are many more improvements that take care of the details that used to fall just short.
Stronger symbology and expressive power
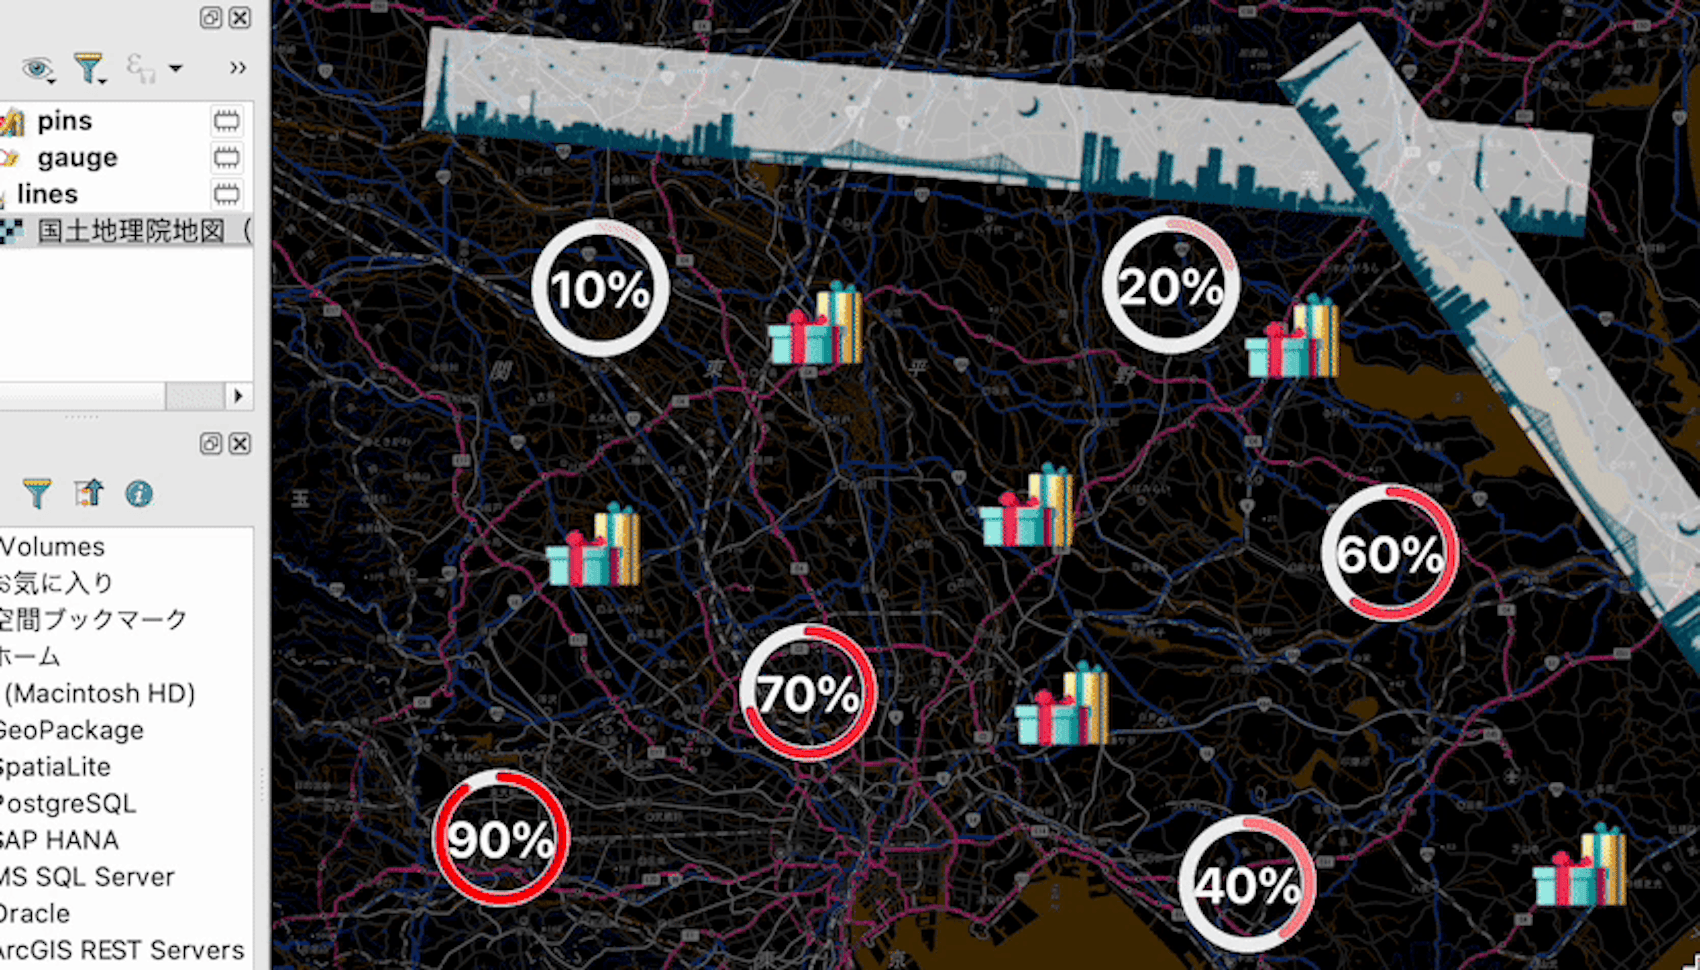
The ability to make maps look attractive has improved as well. Examples related to symbols:
- In QGIS 3.26, the Animated Marker symbol lets you use animated GIF images as markers (see the example in the figure above). You can also add animation to existing symbols.
- In QGIS 3.24, the Raster Line symbol lets you fill a line with an image you specify (see the example in the figure above).
- The GUI for dynamic SVGs in QGIS 3.18 lets you control the content of an SVG marker with an expression (see the example in the figure above). With some ingenuity, quite advanced styling should be possible.
Examples related to labels:
- QGIS 3.10 had an experimental implementation for coloring labels with HTML, and in 3.28 you can also specify bold, italic, font-family, and font-size with HTML.
- QGIS 3.20 added balloon (speech bubble) callouts and curved line callouts.
- QGIS 3.20 made it possible to move the starting point of a label callout with the Move Label tool, and 3.26 made it possible to move labels on lines along the line, so adjusting the display is easier too.
More comfortable digitizing (geometry editing)
- In QGIS 3.20, 3.22, and others, snapping during geometry editing was greatly improved and is now overwhelmingly faster. QGIS no longer freezes while processing snaps.
- QGIS 3.8 made it easy to continue adding vertices from the end point of a LineString.
- QGIS 3.20 added freehand input with Stream Digitizing, as well as the ability to select vertices by polygon and to snap to line endpoints.
The flexibility of input (digitizing) is steadily improving as well.
Processing
A great many Processing algorithms have been added, too many to introduce here. Rather than individual algorithms, here are some examples of improvements to the Processing framework in general:
- QGIS 3.4 made it possible to apply some algorithms to selected features “in place” (without creating a new layer) (the new “Edit in place” mode).
- QGIS 3.32 made it possible to set a feature filter on a vector layer used as Processing input.
- QGIS 3.14 brought various enhancements to the Model Designer.
- QGIS 3.4 made it possible to store models inside the project, which is handy for models that are used only in that project.
There have also been many improvements to existing algorithms, such as the overhaul of the algorithm that generates raster XYZ tiles in QGIS 3.8.
Stronger support for height and 3D information
As support for three-dimensional data such as point clouds, meshes, and vector layers with Z values advances, the features for visualizing that data have been strengthened too.
Elevation profile plotting added
QGIS 3.26 came with a native elevation profile tool. It can generate an elevation profile that mixes vector, raster, mesh, and point cloud layers. From QGIS 3.30, you can also place an elevation profile in a print layout. The article below covers it in detail.
Improved 3D map views
The 3D map views for all kinds of three-dimensional data have also been strengthened. They used to have stability problems, but in the current QGIS 3.32 they can often display fairly large datasets. There is also a feature for exporting 3D scenes in a format that general 3D applications can handle (QGIS 3.16). Many visualization options have been strengthened as well, such as point cloud triangulation, which shows a point cloud as a surface (QGIS 3.26).
3D Tiles and vertical CRS support planned
The ability to load “3D Tiles,” which are used in 3D geospatial visualization such as CesiumJS, is planned for the next release, QGIS 3.34. Support for vertical coordinate reference systems (CRSs), long a concern for handling 3D data correctly, is also planned for 3.34. Continued investment in 3D keeps strengthening these features.
Steady bug fixes
The QGIS changelogs list many bug fixes under “Notable Fixes.” Thanks to this steady work, instability and odd behavior seem to decrease with each version.
Few breaking changes
Despite the many improvements and added features, the QGIS Visual Changelog lists only two “breaking changes” that could stand in the way of upgrading.
- DB2 Support Removed in QGIS 3.26
- Dropped project backward compatibility for symbology with QGIS 3.16 and older in QGIS 3.28
Conclusion
This article looked back at the evolution of QGIS from 3.0 to 3.32. The changes are so wide-ranging that many features are not covered here. Not only the eye-catching new features but also features that many people use every day have been refined, and stability and speed have improved too. If you use an old version of QGIS, try installing the latest QGIS.
If your organization has trouble upgrading the version of QGIS it uses, MIERUNE can help. Feel free to contact us.

QGIS LAB is a comprehensive information hub for QGIS, the open-source GIS software. Under the concept of “Geospatial for Greater Good,” we share the knowledge and skills to open up the world through location data.


