
Drawing Points, Lines, and Polygons in QGIS
What you'll learn
- How to add points, lines, and polygons to vector data
- How to draw point, line, and polygon features
- How to correct features
Recommended for
- Anyone who wants to add features (points, lines, and polygons) to vector data
- Anyone who wants to create new data
Introduction
How do you create your own features in vector data such as GeoPackage or Shapefile? This article shows how to create features such as points, lines, and polygons in vector data.
This article assumes that the vector data already exists. To learn how to create new vector data, see the following article.
Show the toolbar
Use the Digitizing Toolbar to edit features.

If the Digitizing Toolbar does not appear, right-click the toolbar area and check Digitizing Toolbar.

Add points, lines, and polygons
To add features to vector data, you first need to switch to edit mode.
- In the Layers panel, select the layer you want to add features to.
- Click the Toggle Editing button.

A single vector layer cannot mix features with different geometry types, such as points, lines, and polygons. You can add only features of the geometry type you selected when you created the vector data.
Create point data
With the layer in edit mode, click the Add Point Feature button. The cursor on the map canvas changes to a crosshair.

With the cursor showing as a crosshair, click the map canvas to create a point layer.
- Click where you want to create the feature.
- A form for entering attribute values appears. Enter the values as needed and click OK. (You can also enter attribute values later.)
- QGIS creates the point layer.

Create line data
With the layer in edit mode, click the Add Line Feature button. The cursor on the map canvas changes to a crosshair.

With the cursor showing as a crosshair, click the map canvas to create a line.
-
Click where you want to start the line.
Keep clicking to create a line that connects the points.
Right-click to finish.
-
A form for entering attribute values appears. Enter the values as needed and click OK. (You can also enter attribute values later.)
-
QGIS creates the line layer.

Create polygon data
With the layer in edit mode, click the Add Polygon Feature button. The cursor on the map canvas changes to a crosshair.

With the cursor showing as a crosshair, click the map canvas to create a polygon.
- Click where you want to start the polygon. Keep clicking to create a polygon that connects the points you click. Right-click to finish.
- A form for entering attribute values appears. Enter the values as needed and click OK. (You can also enter attribute values later.)
- QGIS creates the polygon layer.

Save your edits
When you finish editing, click the Save Layer Edits button to commit your edits.

Click the Toggle Editing button again to stop editing. Once you leave edit mode, you can no longer add features.

Correct a line or polygon while drawing it
If you click a wrong point while drawing a line or polygon and want to redo the last point, press the Backspace key or the Delete key to delete the last point you clicked.

Draw freehand
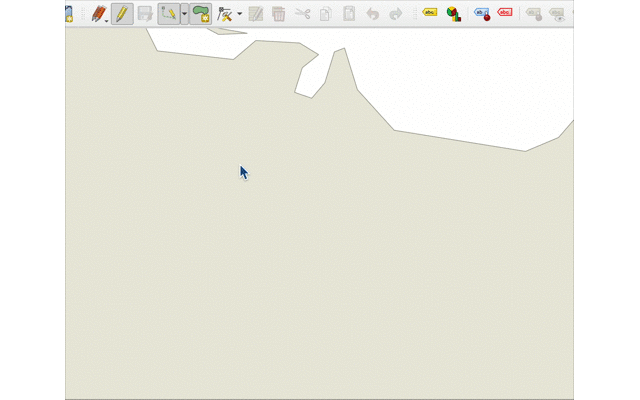
When you create lines and polygons, you can also draw shapes freehand instead of clicking.
By default, lines and polygons are drawn with Digitize with Segment. Click the ▼ arrow next to it and select Stream Digitizing to draw lines and polygons freehand.

With Stream Digitizing, click the first point, and from then on you can draw the feature just by moving the mouse. Right-click to finish.
Conclusion
This article introduced the basic drawing methods for adding and reshaping point, line, and polygon features.
More advanced drawing methods exist beyond those covered here, such as snapping to the shapes of existing vector data and tracing features. Other articles will cover them.

QGIS LAB is a comprehensive information hub for QGIS, the open-source GIS software. Under the concept of “Geospatial for Greater Good,” we share the knowledge and skills to open up the world through location data.


