
Web Attribute Tables for QGIS Data in Kumoy
What you'll learn
- What you can do with the web attribute table feature in Kumoy
- The benefit of checking and updating maps and attribute information on the same screen as a team
- Concrete ways to use it for facility management, field checks, review work, and sharing with stakeholders
Recommended for
- Anyone who wants to check data created in QGIS together with its attribute information on a web map
- Anyone who wants to find or narrow down points and polygons on a map from a list
- Anyone who wants to share maps and attribute information clearly with stakeholders who do not use QGIS
Introduction
In QGIS, the attribute table lets you browse the attribute information of features in a list and search and filter it, so you can check the data you need efficiently.
Kumoy maps offer the same through the attribute table feature. You can view attribute information in a list, find the feature you want in a large dataset, and narrow the data down to features that meet specific conditions. Because you can check data with the same feel as QGIS, checking data on a web map becomes smoother.
This article shows how Kumoy's attribute table feature makes it easier for teams to check, share, and review QGIS data.
What is Kumoy's attribute table feature?
Kumoy's attribute table feature brings the attribute table browsing and filtering you do in QGIS to the web browser.
In QGIS, you open a layer's attribute table to see the attribute values of each feature in a list. In Kumoy, too, you can open the attribute table from the vector viewer or map viewer on the web and check the data while moving between the map and the attribute information.
With it, you can:
- Select a feature in the attribute table to display it
- Sort by attribute value
- Change the order of attribute columns
- Change which attribute columns are displayed
- Filter features by attribute value
The key point is that you can check the location on the map and the tabular attribute information on the same web screen.
Without opening QGIS, you can check both “where a feature is” and “what attributes it has” on a web map. This makes it easier to convey the contents of the data not only to QGIS users but also to reviewers, field staff, clients, and other stakeholders inside and outside the team.
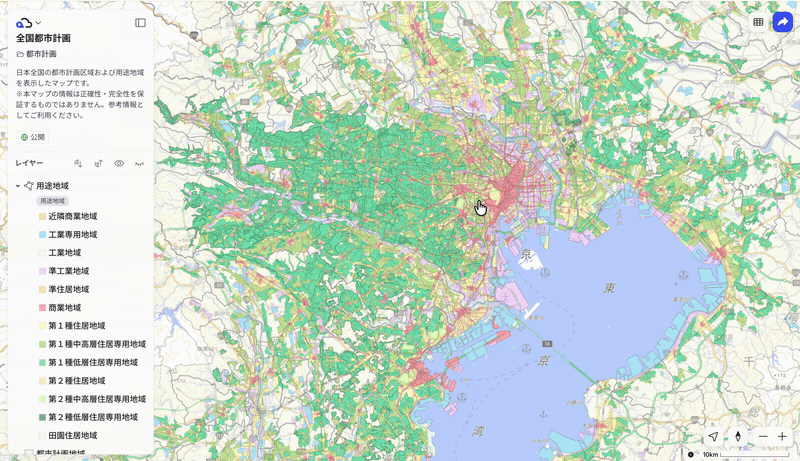
Benefits of using the attribute table on the web
The attribute table is not just a feature for showing a table on the web. By letting you check attribute information and narrow data down with filters on the web, as you do in QGIS, it makes collaboration easier: review requests, reviews, updates in the field, and sharing with stakeholders.
Check data while moving between the map and the list
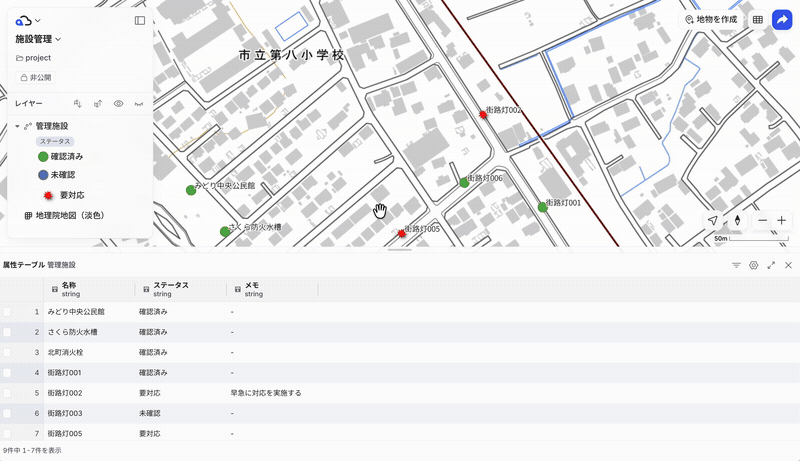
With the attribute table, you can check a feature on the map and its attribute information on the same screen.
For example, with facility management data, you can see the facility locations on the map while the table lists the facility name, type, inspection status, person in charge, and notes. Differences in attributes that are hard to grasp from the map alone are easier to compare in a table.
When you select a feature from a row in the attribute table, the map moves to the location of the selected feature and you can check its attribute form. You can go to the feature you want from the list instead of only searching on the map, so even datasets with many features are easier to check. When you ask a reviewer to “look at this feature,” you can refer to both the map and the table, which makes it easier to get the team on the same page.

Check and update attribute information on the web
With the attribute table, you can review the attribute information of each feature in a list and update values from the attribute form when needed.
For example, you can check equipment marked “Unchecked” in facility inspection data and change the status to “Checked,” starting with the items whose work is finished. Or you can add notes about what you confirmed on site.
Because you can go from checking to updating in a web browser without opening QGIS, field staff and reviewers can take part in updating data more easily. Requests for corrections are less likely to pile up on GIS staff alone, and the team can share the work of getting the data in order.
It is convenient that this whole flow can be completed on the web: check the location on the map, review the status in the attribute table, and update the information you need.

Narrow down to the features that meet your conditions
In the attribute table, you can filter features by attribute value.
For example, with equipment management data, you can “show only features whose status is Needs checking,” “check only the features assigned to me,” or “view only features whose type is disaster prevention equipment.”
When you set a filter, not only the attribute table but also the features on the map narrow down to those that meet the conditions. This makes it smooth to specify conditions in the table and then check the distribution on the map. You can switch the display by reviewer, by check status, or by target area, which is also useful when a team divides up the work area for checking.
Note that a filter is a temporary display condition for the time you are viewing the map. It is not saved as a setting of the public map itself, and it resets when you reload the page. It is useful when you want to narrow down the display temporarily while checking.
Examples of how to use it
Checking facility and equipment information
For data such as facility registers, equipment management records, and inspection targets, it helps to check the location on the map together with the attribute information.
For example, if you manage streetlights, fire hydrants, disaster prevention warehouses, and park equipment, you can check their placement on the map and list the facility name, type, status, last check date, and notes in the attribute table.
You can also filter down to only the equipment marked “Action needed” and see on the map which areas they are concentrated in. Instead of managing the map and the table separately, you can check them with the location and attribute information kept linked, which is convenient.
Organizing field check results
In field surveys, you sometimes need to organize information gathered on site later, such as check status, notes, information for managing photos, and survey dates.
With Kumoy's attribute table, you can look through survey points in a list, which makes it easier to find unchecked points and points that need action. It also makes it easier to divide roles, for example field staff checking on the web map while office staff review the list in the attribute table.
Combined with the web feature editing feature, you can also build a flow in which you update what you confirmed on the map as attributes and then review the result in the attribute table.
Internal review and checking
When you review data created in QGIS within your company, reviewers are not necessarily familiar with operating QGIS.
With the attribute table, reviewers can look at the map in a web browser and check attribute values in a list. Points that are hard to notice from the appearance of the map alone, such as inconsistent name spellings, wrong classifications, missed status updates, and missing notes, become easier to check. It is also easier to ask members who are not used to QGIS to review, so you can spread review work across the whole team.
With filters, you can also narrow down to only the review targets. For example, you can view only “Unchecked” features or show only “Awaiting review” features.
Sharing information with clients and stakeholders
When you share a map with a client or other stakeholders, the map alone may not convey “what this feature represents” or “what attributes it has.”
With the attribute table, they can look at the web map and check the attribute information they need as well. They can check the map and attribute information in a browser without being handed a QGIS project or data files, which makes it easier to get everyone on the same page.
The feature is especially well suited to data you want to check in both a map and a list, such as candidate site lists, inspection target lists, and facility management registers.
Conclusion
With Kumoy's attribute table feature, you can use the attribute table browsing and filtering you do in QGIS in a web browser too. You can view attribute information in a list, show only the attributes you need, sort by value, and narrow down to features that meet your conditions, so checking data as a team becomes smoother.
This is not simply a feature for “viewing a table on the web.” It is a feature that connects the location on the map with attribute information, so stakeholders can check, review, and update while looking at the same data.
GIS staff create data in QGIS and share it with Kumoy as a web map, and stakeholders check the map and attribute table in a browser. This way, people who use QGIS and people who do not can talk based on the same data. The great value of the attribute table feature is that it makes it easier for teams to put GIS data to use.
For detailed steps, see the Kumoy manual page.
Manage the Attribute Table and Filters - Kumoy Docs
Data used

QGIS LAB is a comprehensive information hub for QGIS, the open-source GIS software. Under the concept of “Geospatial for Greater Good,” we share the knowledge and skills to open up the world through location data.


