
How to Read and Use the QGIS Attribute Table
What you'll learn
- How to read and use the QGIS attribute table
- Steps to export attribute table data to Excel
- Why garbled text appears in the attribute table and how to fix it
Recommended for
- Anyone who wants to learn the basic operations of the attribute table
- Anyone struggling with garbled text in the attribute table
Introduction
The attribute table in QGIS displays the information that location data holds in table form. It contains the attribute data for each layer, such as name, area, and population. This article explains the basics of using the attribute table in QGIS.
Open the attribute table
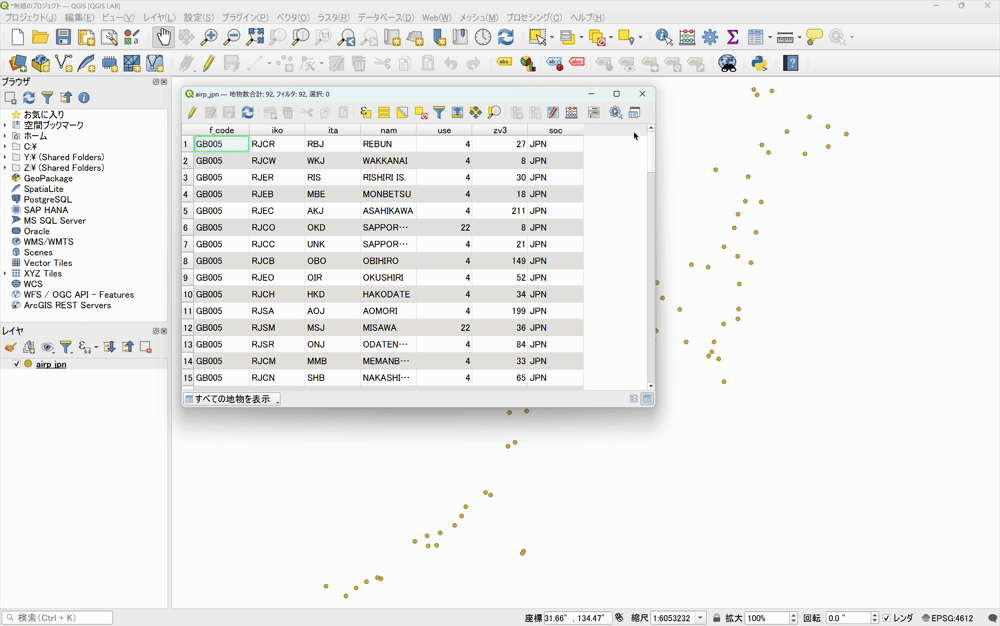
To open the attribute table, right-click the layer in the Layers panel and select Open Attribute Table.

The attribute table opens in a new window and lists the attribute data of the selected layer in table form.

An attribute table consists of fields, which represent columns, and records, which represent rows.
- Field (column): Each column represents a specific attribute. Fields hold many kinds of information, such as name, code, area, length, and classification.
- Record (row): Each row holds the data for one feature (a single shape) in the layer. This ties geographic data and attribute data together one to one.

Data types of attribute data
In attribute data, each field has a fixed data type, so a field can hold only data of that type.
In the airport layer above, columns such as f-code and iko, whose values are left-aligned, are text (string) fields. Columns such as use and zv3, whose values are right-aligned, are numeric fields.
To check the data type of each field, use the Fields tab in the Layer Properties dialog.

Basic attribute table operations
The top of the attribute table has many buttons that give you access to a wide range of functions. This section introduces a few basic operations.
Select records and zoom to features
To select a record, click its record number in the attribute table. To select multiple records, hold Ctrl while clicking, or hold Shift while clicking to select a range.

With the records selected, click the Zoom map to the selected rows button. The map canvas zooms to the features of the records you selected in the attribute table. This lets you find the location of a feature from its attribute data.

Because the attribute table and the features on the map canvas are linked, the corresponding shapes appear highlighted (usually in yellow). Conversely, if you select features on the map canvas, the corresponding records are selected in the attribute table.
Sort by field
Click a field name in the attribute table to sort the records in ascending or descending order.

For example, you can sort numeric values from largest to smallest or smallest to largest, or sort by name.

Switch the attribute table view
By default, the attribute table shows all features, but you can use the button at the bottom left to switch the display by various conditions.

For example, if you select Show Features Visible on Map, the attribute table shows only the features displayed on the map canvas.
You can also switch the attribute table between table view and form view with the Switch to form view and Switch to table view buttons at the bottom right.

In form view, select a feature from the left column, and the field values of that feature appear on the right as a form. Form view is convenient for editing values.

You can change the values shown in the left column with the ▼ button at the top.

Filter the attribute table (search by value)
Filtering lets you show or hide specific records in the attribute table. It is useful when you want to search for features that meet a specific condition.
To filter, click the Select/filter features using form button at the top of the attribute table.

A form opens. This example filters on the zv3 field, which holds elevation values.
Enter 100 in the input box, click the Exclude Field button on the right, and select Greater than or equal to (≥) from the list. Then click Filter Features at the bottom.

This applies the filter, but the result is hard to see. Click the Switch to table view button at the bottom right to change from form view to table view.

In the attribute table, the records are now filtered to only the features whose zv3 (elevation) is 100 or more.

To remove the filter, click the × button at the bottom, and then click the Apply button.

Dock the attribute table to the edge of the screen
When you open the attribute table, it appears in a window. The window can cover the map canvas and get in the way of your work.
In that case, click the Dock Attribute Table button to dock the attribute table to the edge of the screen, just like the Browser and Layers panels. To undock it, click the Dock Attribute Table button again, and the attribute table returns to a window.

You can freely resize a docked attribute table and move it around the screen. Adjusting the size of the attribute table and the map canvas to fit your task helps you work efficiently.
Open attribute table values in Excel
To work with attribute table values in Excel or a similar tool, the usual steps are to export the vector data as CSV and import it into Excel (right-click the layer and choose Export). Alternatively, you can copy the values in the attribute table and paste them directly into Excel.
In the attribute table, press Ctrl + A to select everything, and then press Ctrl + C to copy. Next, open Excel and press Ctrl + V to paste.

That is all it takes to bring the attribute table values into Excel.
Fix garbled text in the attribute table
When you open the attribute table, the values may be garbled, as shown below.

A mismatch in character encoding is a likely cause of garbled text in the QGIS attribute table. When you work with data that contains multibyte characters such as Japanese, garbled text can appear if you do not specify the appropriate character encoding.
If garbled text appears, follow these steps. Right-click the layer in the Layers panel and select Properties. Select the Source tab on the left, and then choose the appropriate encoding from the Data source encoding drop-down list.
Most data that contains Japanese is created in UTF-8 or Shift_JIS, so switching between the two usually fixes the garbled text.

After you change the encoding, check the attribute table. Changing from UTF-8 to Shift_JIS fixed the garbled text in the attribute table.

Conclusion
This article introduced the basic operations of the attribute table: selecting records, zooming to features, sorting, and fixing garbled text.
The attribute table also has many other functions, such as adding and deleting fields, editing values, and the Field Calculator. A separate article will cover how to use these more advanced functions.

QGIS LAB is a comprehensive information hub for QGIS, the open-source GIS software. Under the concept of “Geospatial for Greater Good,” we share the knowledge and skills to open up the world through location data.


